
Capturing Visitors’ Gazes: Three Eye Tracking Studies in Museums
Silvia Filippini Fantoni, USA, , Kyle Jaebker, USA, Daniela Bauer, Germany, Kathryn Stofer, USA
Abstract
The objective of the paper is to share with the wider museum community the results of three different eye-tracking studies that have been conducted at the Indianapolis Museum of Art, The Deutsches Museum in Munich, and the Hatfield Marine Science Center Visitor Center in Newport, Oregon. Topics addressed include: the type of eye tracking equipment used, accuracy levels, technical development needed, possible limitations, as well as insight obtained about visitor gaze and effectiveness of interpretation strategies.
Keywords: eye tracking, gaze tracking, visitor attention, visual processes, research
To Ed, without whose talent and dedication this project would not have been possible. He will be missed by his friends and colleagues.
1. Introduction
While museums have many different ways to measure attendance in their galleries, little progress has been made towards understanding just what those visitors do when they enter the galleries: Which objects or exhibits do they look at? Which elements of a specific object/exhibit do they focus on? Do they read labels? Do they use other forms of interpretation (contextual images, videos, 3D reconstructions, data, etc.)? What interpretation strategies are more effective?
In order to address some of these issues, museums have traditionally employed a series of conventional investigation tools such as observation, timing and tracking, and interviews. These, however, can be very time-consuming and labour-intensive, as well as limited by the fact that it is not always possible for an observer to clearly determine what exactly a person is looking at. As a result, museums have started to look into alternative, less-time consuming solutions for tracking visitors‘ gaze. Amongst these are eyetracking technologies, which thanks to the most recent developments in the field, have the potential to provide a more automated way to understand visual processing in museums (Bachta et al, 2012).
Given the potential of eye tracking technology to capture visitors’ gazes less obtrusively, the Indianapolis Museum of Art, the Deutsches Museum in Germany, and the Hatfield Marine Science Center Visitor Center in Newport, Oregon, have carried out a series of independent studies using eye-tracking technology with the aims of:
- studying what visitors are looking at, including both art and science as well as printed, 3-D, and digital exhibits;
- testing the effectiveness of different interpretation strategies; and
- better understanding visual processing in these settings.
In the sections below we will analyse each individual case study, including the type of eyetracking equipment used, accuracy levels, technical development needed, possible limitations, as well as insights obtained about visitors‘ gaze and interpretation strategies. Based on the experiences of these three organisations, we will then draw some joint conclusions on the effectiveness of eye tracking and its practical use in museums.
2. The Indianapolis Museum of Art: Gauging the Practical Use of Eye Tracking in Museums
Seeking to explore useful and practical means of applying eye-tracking technology to common problems faced by museums, the Indianapolis Museum of Art (IMA) was awarded in the spring of 2011 an IMLS Sparks! grant with the aim of:
- gauging the practicality of using such devices in a gallery setting;
- determining the ability of current eye-tracking technology to measure precisely how long and what people are looking at; and
- exploring the potential use of this equipment in a practical setting like a Visual Thinking Strategies (VTS) discussion (http://www.vtshome.org/).
These issues have been addressed and tested in the context of three separate experiments that were conducted at the IMA between July 2011 and June 2012.
Preliminary tests
The first step in the process of setting up these experiments was to select an eye-tracking device. Of the models available on the market, we opted for the EyeTech Digital Systems VT2 eye tracker (http://www.eyetechds.com/ – see Bachta et al. 2012 for a brief description of how the device works and the reasons for choosing it over other models). Despite the fact that the EyeTech Digital Systems VT2 eye tracker was the right choice for our experiments at that point in time, the product had some limitations particularly in regards to range, which became evident during the preliminary testing phase.
Due to the attenuation of intensity from the infrared emitters and the characteristics of the lens, the tracker has an ideal viewing range that was found to be approximately 25 inches from the front panel. It is also unable to detect the eyes if they are looking too far past the left or right edges of the device (the field of view is about 36 degrees at this distance), or too high above the device.
In regards to the proposed experiments, detection of the eyes of a person with arbitrary height when standing was not reliable, as adjustments to the position and/or angle of the tracker was required. Therefore, our experimentation was restricted to a scenario in which the viewer was seated, with the tracker placed in a fixed position and orientation on a desk or pedestal approximately 50cm in front of the seat and 20cm below eye level. The boundary of the artwork also needed to be well inside the 36 degree field of view that the tracker is able to operate within.
Experiment 1
After considering the limitations of the device, the objective of the first experiment was refined to assess the accuracy of the eye tracker, in terms of the length of time and the location of the seated participant’s gaze while looking at a work of art. In a live deployment, it would be ideal to avoid disrupting a visitor’s normal pattern of viewing the art by requiring calibration, so a key component of the experiment was to test whether the device performed well when not calibrated for each participant.
The experiment consisted of two phases. In phase one, the seat was placed at the distance determined to be ideal based on the preliminary tests and was not moved from that position. Over a period of sixty seconds, participants (22 in total) were asked to look in the field of the painting (Hotel Lobby by Edward Hopper) then outside, and then directed back inside. Simultaneously, two research assistants observed the participants and used stopwatches to manually track time of gaze in bounds (Figure 1). These recorded times were then averaged and compared to the time tracked by the device to gauge accuracy.

Figure 1: A session of experiment 1 underway in the gallery.
In phase two, the procedure was as detailed above, but if the device did not pick up participants’ gazes when first getting into position, these participants were asked to move the seat until they could see their eyes reflected back in the device and the system reported that it could detect the eyes fairly consistently.
Some participants from phase two were also asked to take part in a secondary experiment in which the ability of the device to accurately track gaze location when not calibrated for each viewer was assessed. Participants were instructed to look at six different areas within the painting for 10 seconds each. Tracker data was logged in the same manner as the other sessions.
The results of this first experiment, which are described in detail in Bachta et al. (2012), indicated that the eye tracker was unable to continuously capture data for the duration of each session and, as a result, to identify precisely the time spent by participants looking in and outside the painting. Allowing the viewer to adjust the position of the seat improved the accuracy, but not to the degree that the computed duration was a reliable measurement.
Experiment 2
Based on the accuracy issues that emerged in Experiment 1, it was decided to repeat the same sequence of steps for experiment 2, but in these sessions the device was calibrated for each participant to see if the results would be more accurate both in terms of time and location of the gaze within the painting.
Twelve IMA staff participated in this second experiment. These participants were selected amongst the 22 who had taken part in the first experiment. Unlike the first experiment which took place in the gallery, this experiment was carried out in one of the IMA Adult Lecture rooms, where the exact size of the same painting that was used in experiment 1 was reproduced on a white board. Specific points were drawn on the board and accuracy was judged at these points (Figure 2). The use of the board as opposed to a painting reduced the chance of distraction during this test of accuracy, and more exact reference points allowed for higher precision in evaluation.

Figure 2: A session of experiment 2 underway in the lab.
The results of this second experiment indicated that the tracker was able to log a larger quantity of valid data during each session. Gaze duration results were better than in the un-calibrated study, but still not 100% accurate.
Gaze location results were also better than in the un-calibrated study, but not as accurate as expected. The average error in gaze location when looking at a fixed point across all participants was 1.64 degrees. From the perspective of eye tracking research, it is debatable whether a difference in the range of 1-2 degrees should be considered an intentional change in gaze location. The best session had an average error of 0.144 degrees, and 6.22 degrees was the worst. It is clear that in some of the sessions it would not have been possible to distinguish between error and an intentional change in gaze location.
Experiment 3
Despite the limitations of the device in terms of range and accuracy that had emerged from the first two experiments, we still wanted to test whether the device could be used as a tool to gauge where people were focusing their attention during a VTS session.
Using the VTS method (Housen, 1999), educators regularly engage groups in interactive discussions seeking to draw out visitors’ thoughts regarding a work of art. While such discussions often provide unique insight into an individual’s thoughts about a work of art, direct measurements of the connection between viewing and thinking are often difficult and subjective.
In order to be able to assess whether eye tracking was a useful tool to examine the connection between gaze and response, as part of experiment 3, video recordings of five VTS sessions were made and synchronized with the data stream from the eye- tracking hardware (to see the videos go to: http://ima.tc/eyetrackingsessions username: guest, password: optics).
During each five-minute VTS session, five people participated in the group discussion led by a facilitator in front of the Hotel Lobby painting that was used in the previous two experiments. However, the gaze was tracked and recorded only for the participant who was sitting in front of the eye tracker and for whom the device was initially calibrated (Figure 3). Given the nature of the eye tracker, it would have been impossible to simultaneously track the gaze of all participants in a discussion with only one device.

Figure 3: A session of experiment 3 underway in the gallery.
During the five sessions the eye tracker was able to capture between 77% and 93% of the session depending on the participant. The percentage of time that the device was not able to track was either due to the limitations of the device highlighted above or to the fact that participants were looking outside of the trackable area.
In order to determine whether the video recordings could be useful in the field of VTS research and practice to study the ways in which visitors approach artworks, we contacted a number of professionals who specialize in VTS. These specialists were asked to view the videos and communicate whether they would find any practical applications of this technology to their work.
All in all, the feedback received from VTS specialists was positive, confirming that, despite the current limitations of the device, recordings of visitors’ gazes through this type of eye tracker can be useful both as a way of assessing the detailed effects of VTS as a discussion-based learning tool and as a training tools for facilitators.
Lessons Learned
In conclusion, the three experiments have pointed out that the device limitations in terms of range and accuracy make it difficult to use this type of eye tracker as a reliable and easy-to-implement solution to track where and when visitors look. While not suitable as a practical researcher-free/unobtrusive implementation for measuring attention in museum galleries, this type of tool, however, can still be useful in a more experimental setting for in-depth analysis of specific interpretation strategies and for training purposes, as feedback from VTS specialists indicate. The same technology could be applied to different teaching strategies, such as gallery talks or lectures, as well as to different contexts (school vs. museum) and/or with different age groups.
3. The Hatfield Marine Science Center: Eye Tracking on a 3-D Digital Exhibit
At the Hatfield Marine Science Center Visitor Center (VC), Oregon State University researchers are engaged in a long-term research program about how visitors make meaning from scientific visualizations of satellite-based Earth system science data (cf. Phipps and Rowe, 2010; Rowe, Stofer, Barthel, and Hunter, 2010; Rowe, Stofer, and Barthel, in preparation). As part of this process, we are testing images with various levels of visual scaffolding, from an unscaffolded image that is straight out of a journal publication to a highly-scaffolded version intended to be clear to people with minimal oceanography background. We have used eye tracking in a laboratory setting to investigate differences between undergraduates (novices) and professors (experts) in attention to various elements of the images in order to inform our design. Here, we explore the use of eye tracking with the digital 3-D exhibit piece in its gallery setting.
Fourteen adult subjects were recruited from visitor groups to the Visitor Center on four consecutive weekend days in January 2013 as they approached the spherical display system (Magic Planet™) exhibit. The entire group was asked whether any of them would be willing to participate, and a volunteer was identified as the subject.
Physical Setup
The SMI RED stand-alone eye tracker was placed on a tripod. After inputting the screen size and selection of subjects who would be standing, iViewX software recommended position for the eye tracker height and distance from the screen so that the tracker was the 60-80 cm from the visitor’s eyes. The Magic Planet was then 169cm in front of the visitor, behind the eye tracker (Figure 4), which was set at a height of 151 cm from the floor to the bottom of the stand/foot of the tripod and an initial angle of 8 degrees.

Figure 4. The HMSCVC experimental setup.
Due to the constraints of the eye tracker, subjects were only able to view about 1/4-1/6 of the globe, instead of the whole globe as would normally be available to exhibit users. Subjects also were not able to access the exhibit kiosk because it was out of the range of readability.
Experimental Conditions
Because we are interested in understanding how visitors view images of data with supporting material presented in titles and color keys, we prepared two versions of images for each of two ocean topics, sea surface temperature anomaly (“SST anomaly”; data used to determine El Niño, La Niña, or neutral conditions), and chlorophyll-a (a proxy for primary producers in the ocean food web). Each subject was presented with one version from each topic; one version that was essentially straight from a scientific publication (“Scientific Level”) and one version (“General Level”) that was altered in colors, title, geographic labels, color key placement, and measurement units intended to be more understandable to a general audience (Phipps and Rowe, 2010). The order of topic and version was alternated, for a total of four combinations (A, B, C, and D) of image presentations (see Table 1).

Table 1: Presentation order by level and topic.
While normally the title would be displayed on the adjoining kiosk, due to the field of view restrictions presented by the stand-alone eye tracker, the titles and color keys were displayed on the part of the image on the sphere that the subject could view without moving around the screen.
Procedure
Consent was obtained, and then visitors’ eyes were first centered as directed by iViewX software, by moving the subject forward or back or left to right, including if necessary, adjusting the angle of the eyetracker. Subjects were then instructed to stand as still as possible for calibration and the experiment. Next, calibration proceeded with five calibration points shown on the spherical display; visitors were instructed to look at the center cross first, then the researcher verbally directed the visitor to look at the subsequent points in order, while the researcher verified the subjects’ gaze on the laptop screen through iViewX. Data was collected through the iView X software instead of the ExperimentCenter stimulus presentation software because the proprietary software that displays images on the globe was incompatible with the requirements for ExperimentCenter. This means that the researcher was responsible for synchronizing the start and end of the eye-tracking recording with the stimulus presentation.
For the experiment, subjects were instructed to look at the image as long as it was necessary to feel as if they understood it as well as they could. The researcher presented the first image on the spherical screen at the same time as starting the eye tracker data collection. Upon verbal indication by the subject that they were through looking, the researcher stopped the eye recording. The researcher then asked five questions about the image topic, meaning of the colors, area of the image with the highest values, time span of data presented, and season of the year presented. During the questions, the subject remained still and the image remained viewable. The researcher recorded answers in field notes.
Once these five questions were answered, the researcher gave the same instructions to view the image as long as necessary for understanding, then displayed the second image while simultaneously starting the eye tracking through iViewX. Once the subject verbally indicated completion, the recording was stopped, and the subject was asked the same five questions, though they were allowed to relax as the recording portion of the experiment was finished at this point.
Finally, the subjects were asked about their comfort with interpreting such visualizations as were presented on a Likert-type scale of not at all comfortable, comfortable, or very comfortable, and what school, professional and/or informal science background they had. These questions are similar to ones asked in the laboratory setting.
Findings
Data was imported into SMI’s BeGaze software for analysis. Eye-tracking data was overlaid onto photos taken of the sphere and imported into BeGaze after cropping to match the calibration image of 1920×1920 pixels. However, since the eye tracker calibration was set to an area of 1680×1050, despite uploading a calibration image and matching points as described in the manual, the stimulus images did not immediately line up in a meaningful way with the tracking data. Instead, the data seemed defined to the upper-left portion of the stimulus image.
This qualitative view of the data is an important first step to interpreting the quantitative data that the tracker records. For one thing, it allows us to visually inspect the data and determine whether it “makes sense” on a first-pass. For another, it allows us to match fixations to particular locations on the image, as we are interested in not only how long (duration) visitors look at the image, but also where they look, specifically the title, color bar, “hot spots” in the image, and/or geographic labels. The “best fit” visually required us to warp the stimulus images for analysis from 1920×1920 pixels to 1680×1050 for viewing in BeGaze.
At this point, it is difficult to tell whether or not the eye-tracking data collected in this manner is usable. Of 33 trials (some subjects were shown 3 images), only about half (16 trials) displayed scan paths similar to those found from laboratory experiments, that is, with fixations and paths tracked between those points (Stofer, in preparation, see Figure 5).

Figure 5: Comparison of typical (dark blue) and suspicious (teal) scan paths.
The path in dark blue represents a “typical” scan path, with fixations and paths drawn between points over 20 seconds of viewing. The path in light teal blue shows only two paths in 20 seconds, with fixation sizes too small to make up for the remaining time (larger diameter of spot indicates longer dwell time). In the gaze replay video, however, the gaze is shown moving all around the image, casting suspicion on all the path data displayed. This limits the usefulness of any analysis of where subjects are looking at the images.
Lessons Learned
The stand-alone eye tracker should allow us to collect data in a more naturalistic setting than previous laboratory-based experiments (Stofer, in preparation), i.e. an exhibit in a science center. It allowed us to present data at the normal size of the exhibit, under typical less-than-ideal lighting conditions, and in three dimensions in the noisy, high-distraction context, rather than on a smaller 22”, well-lit flat screen computer monitor in a quiet, isolated room. However, it limited the examination of the full exhibit, including kiosk and 360-degree affordance of the screen that visitors could normally walk entirely around. Data preparation, collection, and analysis is highly time-consuming compared to the laboratory setting, which allows software-driven calibration verification, synchronization of recording and stimulus presentation, and automated overlay of data to stimulus imagery. It is also harder to interpret due to imperfect matching of the stimulus images to the data paths. It is unclear how many of these problems are due to the digital and/or spherical nature of this exhibit, but given the results of other projects in this paper, it seems likely the eye-tracking system itself and user inexperience accounts for not insignificant parts of the problem.
A glasses-based system for eye tracking would allow even further naturalistic examination and provide an integrated “subject video” to match with what the subject looked at, but the expense may still not be justified if a research group has existing access to a stand-alone system. However, the object of interest and stand-alone eye-tracking system must have capabilities to perform calibration and present stimuli using presentation software and/or capture synchronized subject video using an integrated web camera or similar.
4. The Deutsches Museum: Exhibiting “The Real Thing”: Do Visitors Perceive Authentic Objects Differently?
Museums exhibit objects. In the view of museum professionals, objects are not only a central characteristic of exhibitions, but additionally have certain advantages to them that other forms of displaying content lack (Paris, 2002). Since Walter Benjamin’s essay The Work of Art in the Age of Its Technological Reproducibility (1935), the aura of the authentic, which is lost when an object is recreated in another form of presentation, has been a focus of curators and experts in the field of material culture and humanities (Baudrillard, 1995). Scholze (2004) claims that using objects is significant because it leads visitors to perceive exhibitions as more credible and convincing. Also, she says, objects make the museum experience more fascinating and visitors can more easily connect to heritage and history.
Taking these assumptions into account the Knowledge Media Research Center (IWM-KMRC) in Tübingen and the Deutsches Museum in Munich started a joint project concerned with differences in visitors’ perception and information-processing of exhibition content originating from authenticity. Translating Scholze’s arguments into psychological measures, we conducted studies to investigate empirically whether authentic objects:
- gain higher credibility;
- are more fascinating and therefore get more attention;
- have a stronger argumentative power; and
- lead to a better understanding of the exhibition content.
Communicating Fragile Information in Museums
Science museums, like the Deutsches Museum in Munich, have traditionally focused on the genesis of scientific and technical findings put into the perspective of history and time. Today, however, these museums strive more and more to communicate current scientific topics that change constantly and that are subject to discussion and, at times, controversy amongst the general public. In a similar manner, the role of the object as being a “witness of the past” or “proof of existence” has changed into being a “material argument” for or against modern, ambiguous technologies. The exhibits we developed for the studies relate to the double-edged character of new scientific themes, including body enhancement and nanotechnology. Cogent arguments in support and rejection of these technologies were illustrated by a specific object.
Based on the psychological model of the integrative processing of multiple text documents (Rouet, 2006) and the model of multiple external representations (Ainsworth, 2006), we argue that authentic objects, presented in the context of a multimedia showcase, have the status of a primary source of information. Accordingly we developed showcases for our studies that looked exactly the same, but varied whether an argument was presented through an authentic object or through its identical photographic reproduction. Figures 6 to 9 show the different variations.

Figure 6: Experimental showcase in balanced version with two objects.

Figure 7: Experimental showcase in balanced version with two photographs.

Figure 8: Experimental showcase in unbalanced version with one object and one photograph.
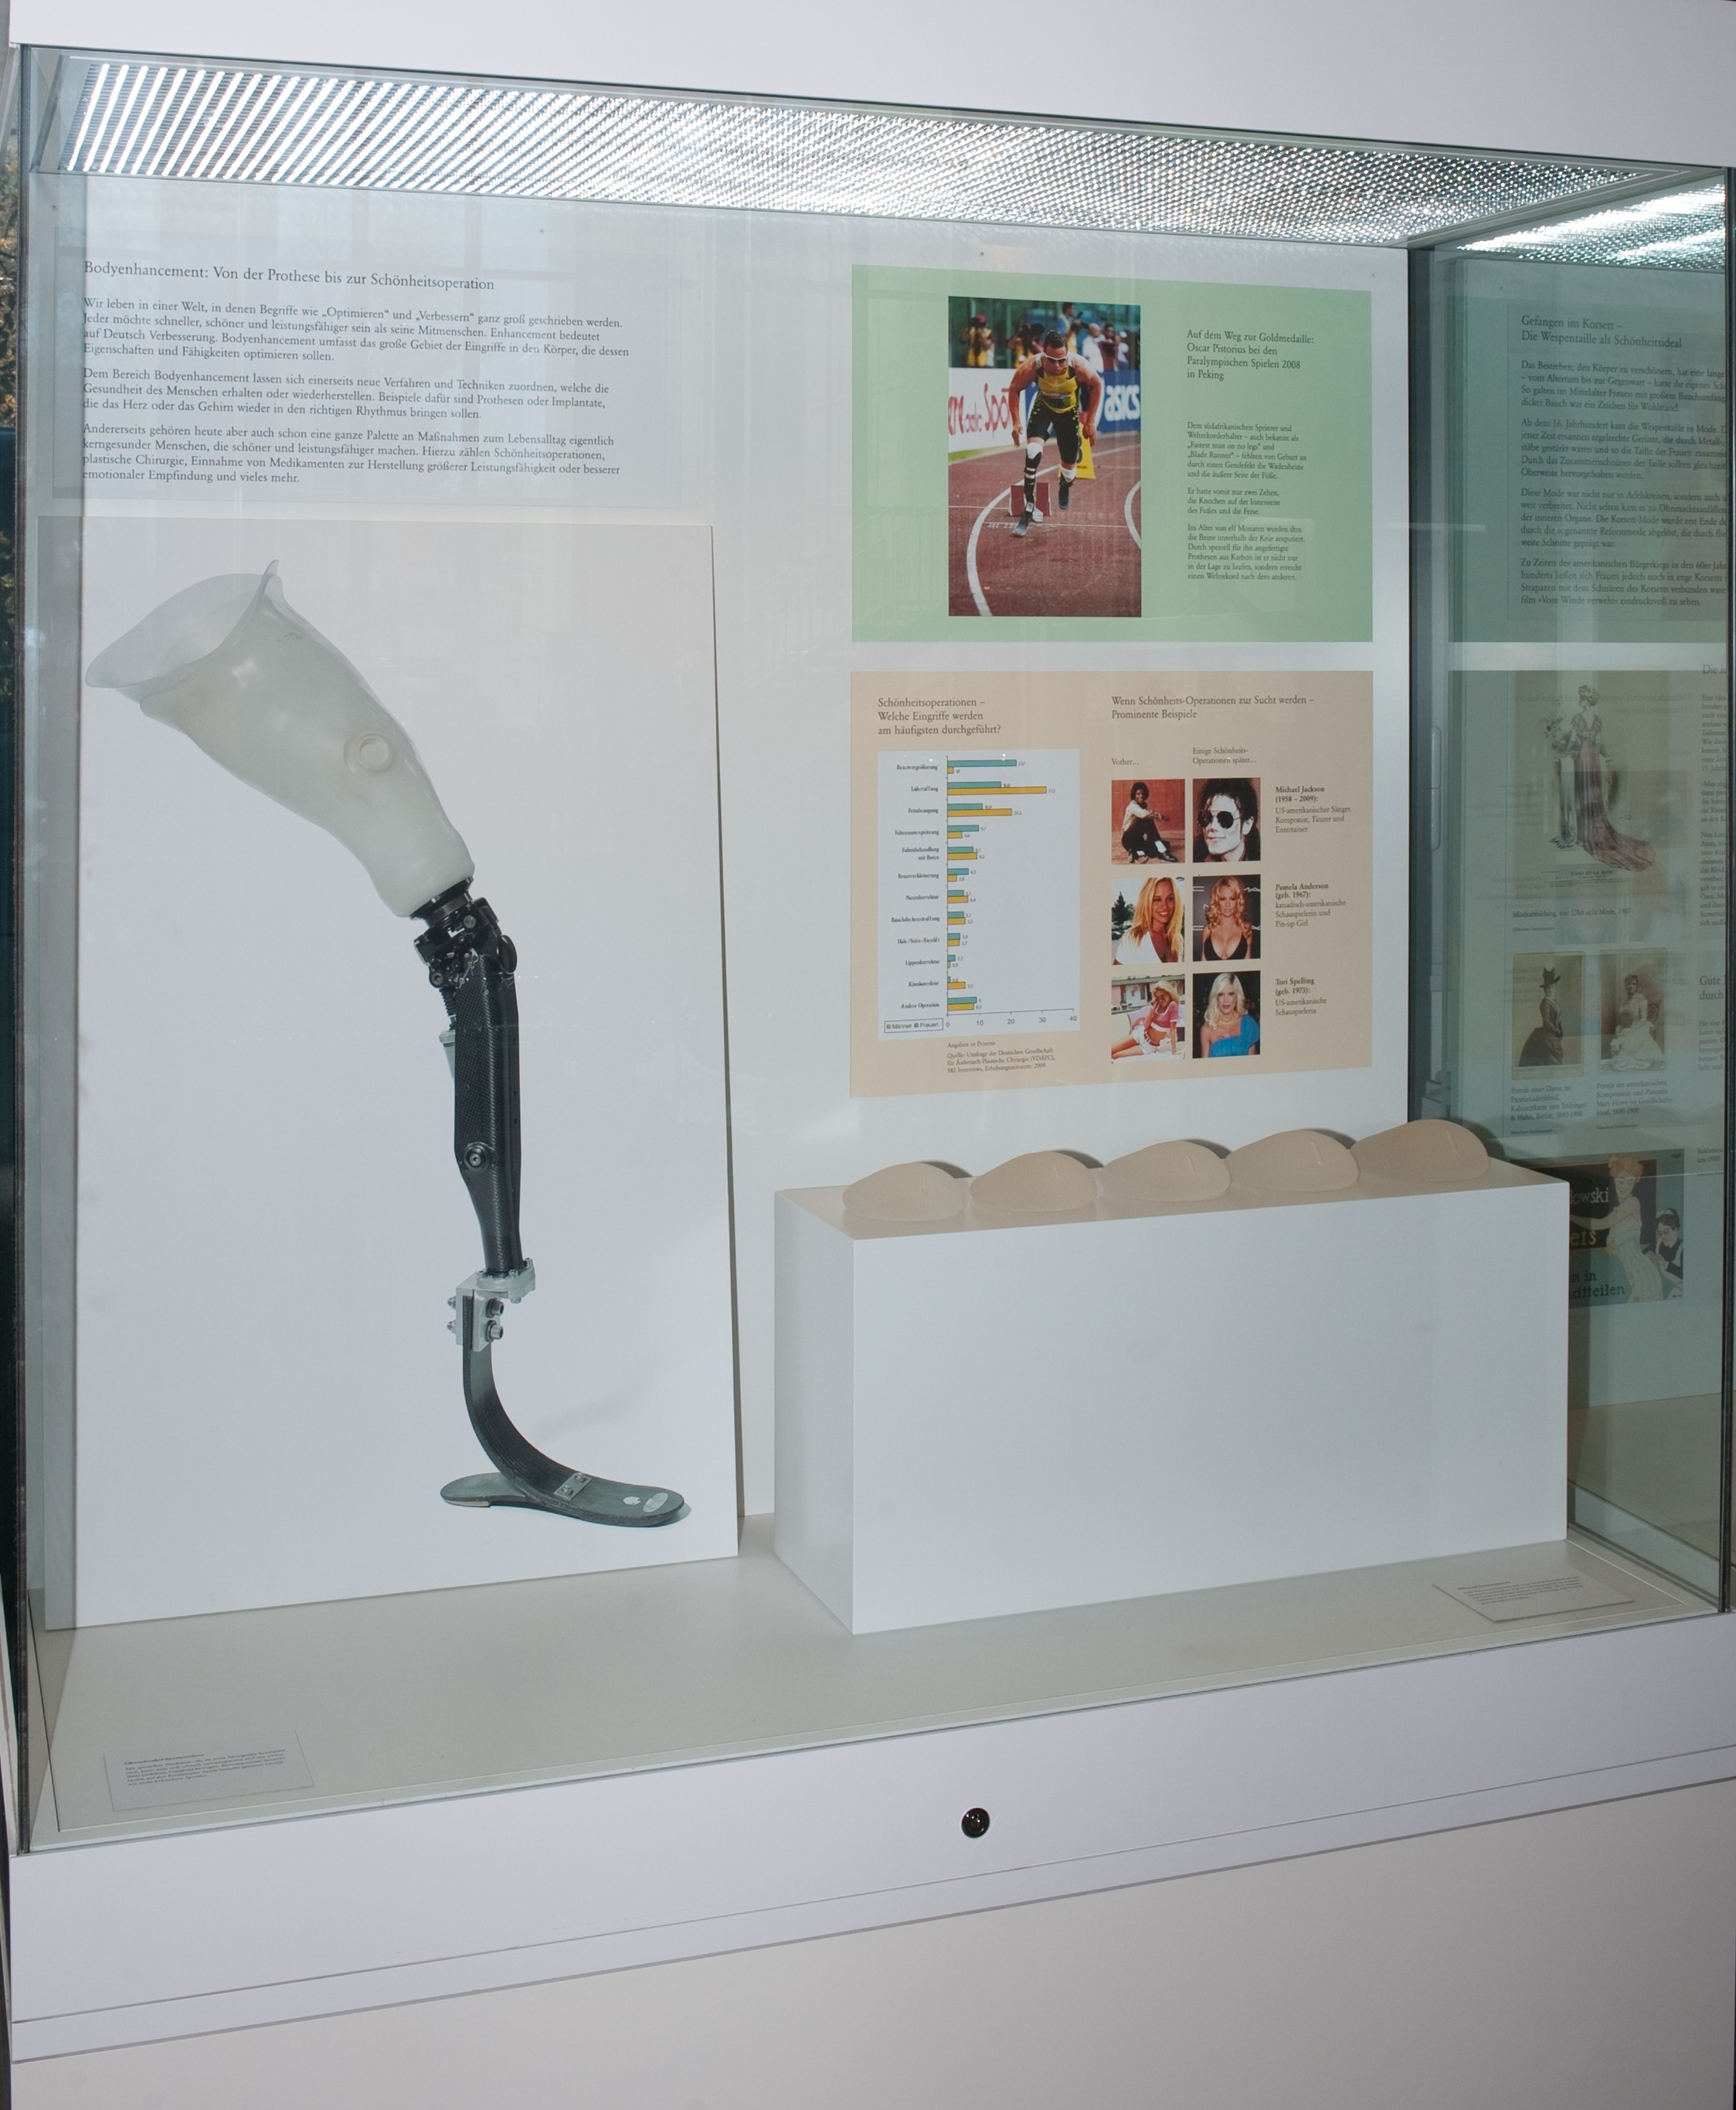
Figure 9: Experimental showcase in unbalanced version with one photograph and one object.
Mobile Eye Tracking as a Way to Measure Attention to Specific Exhibits
The assumption that objects attract higher attention than their photographic reproductions was tested in two field studies in the Deutsches Museum, using a mobile eye tracker to record participants’ eye movements. In contrast to stationary eye trackers, which are used in more or less controlled settings where participants are bound to sit in front of a screen, their heads often stabilized in a chinrest, mobile eye tracking can be used in the field, gaining data from regular visitors while exploring the exhibition or engaging in various tasks (Eghbal-Azar & Widlok, 2012). Compared to other attention-measuring methods in the museum, such as a neutral observer or participants’ estimation, mobile eye-tracking data has several advantages for researchers (Mayr et al., 2009): information about the environment is provided by the scene-camera and gives rich data to the researcher; higher data validity is achieved, because the camera’s view is more “objective” than the one of a human observer; and data can be analyzed using statistics according to sample size and research question. Additionally, in contrast to common timing-and-tracking in museums that is limited to estimating the visitor’s attention between different showcases, mobile eye tracking makes it possible to generate data with a higher level of precision, differentiating how much attention visitors pay to single exhibits inside a showcase.
In our studies we used mobile eye tracking in the museum, gaining high ecological validity but giving it a controlled frame with a clear hypothesis rather than an exploratory focus. Consequently we were interested in a few concrete parameters provided by the eye tracker. Through systematic experimental variation and a large set of participants, we were able to use the eye-tracking data for selected statistical analysis to answer our research questions.
Procedure
Participants were recruited when entering the museum. In both experiments we used a Locarna PT-Mini mobile eye tracker with an update rate of 30 frames per second and a 720 x 480 resolution color camera. The Locarna eye tracker comes with a scene camera that records the participant’s perspective on the exhibition and an eye-camera working with infrared light, both attached on one glass of spectacles and thus recording the movement of only one eye. A notebook with the running eye-tracking software is attached to the spectacles via cable and participants can easily carry it with them in a small backpack. After calibration with 9 reference points, each participant was asked to take a look at our showcases in a natural manner, according to her/his own pace and interests. Figures 10 and 11 show a participant during calibration and the visit of the experimental showcases.

Figure 10: 9-point-calibration of a participant.

Figure 11: Participant with eye-tracking spectacles and eye-tracking notebook in his backpack.
In both our studies we were interested in how long the participant’s eye fixated on objects in contrast to photographs. A fixation was defined by a minimum threshold of 5 frames (about 167 msec) and a minimum diameter of 50 pixels. Using the tagging-software of Locarna, fixations on objects and photographs could easily be distinguished and labeled. Fixation times were calculated summing up the duration of single fixations detected by the software.
Findings and Future Research
In our first study the experimental showcase was unbalanced. We presented two counter poled aspects of an exhibition theme: one through a real object, the other through a photograph. Taking part in this study were 55 visitors with a mean age of 29, including 23 women. Results showed that visitors fixated on the object significantly longer when it was associated with a promising aspect of the exhibited technology and contrasted to a photograph expressing a challenging one. However, the effect was not visible when the showcase was presented the other way around, meaning that an object connected to a negative argument was contrasted to a photograph expressing a positive aspect of the exhibited technology. Thus it seemed that the positive or negative poling of the exhibits interfered with the effect of authenticity.
In the second study (N = 54, 16 women, mean age 28), we therefore presented balanced showcases. Again visitors were confronted with both a positive and a negative implication of the exhibited technology but this time presented with either a pair of real objects or a pair of photographs. Fixation times from visitors that were presented the two real objects were significantly longer than the ones of visitors who saw the photographic substitutes.
According to our results, it appears evident that the authenticity of an object has a positive impact on visitors’ attention. So far we can say that authentic objects definitely outpace photographs of same size and presented in an equal way. But it also shows that this effect is interdependent with other aspects of presentation in the museum. In further studies aspects of staging, particularly regarding given information, design of lights, and placement inside the exhibition, have to be investigated. Currently we are looking at whether this effect is still to be found when it comes to comparing authentic objects to three-dimensional models or digital simulations.
Lessons Learned
Concerning the method of mobile eye tracking, we found that the visitors were very keen to take part in the study. This could influence the normal viewing behavior, e.g., leading visitors to spend more time in an exhibition than they normally would. Depending on the research question this could have an impact on the validity of results. As the calibration grid has to be fixed on the wall and its position cannot be changed for every single test person, very tall or very short participants are difficult to calibrate. Also, calibration is often difficult when the distance between the eyes of the test person is either under or above average.
Mobile eye trackers are very delicate technology. The cameras on the spectacles come with fragile wires and small parts that have to be handled with special care. It is very frustrating when data of participants has to be left out because the cameras stopped working in the middle of testing. When analyzing the data it is sometimes not easy to identify which elements of the exhibition display the user is looking at, as the calibration is completely precise in only rare cases. Allocations have to be made according to the viewing context. Furthermore the preparation of the data for statistical analysis is very time consuming, as every single fixation has to be labeled by hand.
Finally, there is a high variance of fixation times between the individual subjects. The fixation times of one showcase may range from a few seconds to several minutes between participants. This in turn affects the results of the statistical analysis of the data.
5. Conclusions
Despite the different equipment, methodology and objectives, the experiments carried out by these three organizations led to very similar conclusions when it comes to the use of eye-tracking technologies in museums.
First of all, the lack of accuracy of the trackers (independently of the model) both in terms of length of time and location of the visitors’ gaze makes it difficult to determine exactly where the participant is looking and for how long, without calibration for each participant. This, as well as the inability of the device to track complete sessions can be somewhat problematic depending on the specific objectives of the experiment.
While accuracy is improved when the device is calibrated for every participant, the fact that the device needs calibration makes it time-consuming and difficult to use these devices unobtrusively in a regular gallery setting. Other major constraints include the limited range of the device, which only works within a certain distance from the visitor or the object (depending on the model used) and the complexity of the data preparation, collection and analysis, which are labor-intensive, time-consuming and often require competences that most museum staff do not have. Data analysis requirements could also constrain the number of subjects studied.
Furthermore, despite the fact that the prices of eye trackers have gone down recently, there is still a significant cost associated with purchasing such devices, in the neighborhood of $20,000 to $30,000.While this is not an exorbitant amount, it is still a burdensome cost for most museums, which for the same sum could rely on other forms of data collection, such as observation and timing and tracking to better understand visual processing in museum settings.
Despite the limitations highlighted above, the experiments conducted have brought some useful insight into the use of representation vs. real objects in museums, as well as the possibility of using eye-tracking technology as a way to test the effectiveness of some interpretation strategies like VTS and potentially gallery talks, lectures, and digital exhibits. This suggests that while not suitable for a practical researcher-free implementation in museums’ galleries, eye tracking can still be useful in a more experimental laboratory and research setting.
Another positive aspect of using mobile eye tracking in the gallery space is that the data is collected by an objective camera rather than by a subjective observer. The recorded video includes insights into: 1) visitors’ movement inside the gallery space, 2) what exhibits, even at small scale, people look at in detail, 3) how long they look at exhibits, and 4) how often they return to those exhibits. Another advantage is that the session recordings can be replayed for multiple analyses and thus offers a rich and reliable source of data.
Finally, in a more laboratory-like setting stationary eye tracking is useful to understand better meaning-making and information-processing while looking at certain visual items, and when combining it with thinking-aloud or retrospective interviewing methods. Movements of the participants’ eyes can be analyzed in connection to participants’ thoughts according to a specific research question.
We believe overall that eye tracking has potential to be a useful tool for museums of all kinds, albeit with limitations and considerations especially for in-gallery or large study population use.
References
Ainsworth, S.E. (2006) “DeFT: A conceptual framework for learning with multiple representations.” Learning and Instruction 16(3):183–98.
Bachta E., Stein R., Filippini-Fantoni S., Leason T., Evaluating the Practical Applications of Eye Tracking in Museums. Museums and the Web 2012: Proceedings. Toronto: Archives & Museum Informatics, 2012 http://www.museumsandtheweb.com/mw2012/papers/evaluating_the_practical_applications_of_eye_t
Baudrillard, J. (1995) Simulacra and Simulation. Ann Arbor, MI: University of Michigan Press.
Benjamin, W. (1935, reprinted 1977) Das Kunstwerk im Zeitalter seiner technischen Reproduzierbarkeit. Frankfurt: Suhrkamp.
Eghbal-Azar, K., & Widlok, T. (2012) “Potentials and limitations of mobile eye tracking in visitor studies: Evidence from field research at two museum exhibitions in Germany.” Social Science Computer Review. doi: 10.1177/0894439312453565.
Housen, A. (1999). “Eye of the Beholder: Research, Theory, and Practice.” Presented at the conference of Aesthetic and Art Education: a Transdisciplinary Approach. September 27–29, 1999, Lisbon, Portugal. Consulted January 20, 2012. Available at: http://www.vtshome.org/system/resources/0000/0006/Eye_of_the_Beholder.pdf
Mayr, E., Knipfer, K., & Wessel, D. (2009) “In-sights into mobile learning: An exploration of mobile eye tracking methodology for learning in museums.” In G. Vavoula, N. Pachler, & A. Kukulska-Hulme (Eds.), Researching mobile learning: Frameworks, tools and research designs (189–204). Oxford, England: Peter Lang.
Paris, S. (2002) Perspectives on object-centered learning in museums. Mahwah, NJ: Lawrence Erlbaum
Phipps, M., & Rowe, S. (2010). “Seeing satellite data.” Public Understanding of Science, 19(3), 311 –321.
Rouet, J.F. (2006) The skills of document use: From text comprehension to web-based learning. Mahwah, NJ: Lawrence Erlbaum.
Rowe, S., Stofer, K., Barthel, C., & Hunter, N. (2010). Hatfield Marine Science Center Magic Planet Installation Evaluation Findings. Corvallis, OR: Oregon Sea Grant.
Scholze, J. (2004) Medium Ausstellung [Medium Exhibition]. Bielefeld: Transcript Verlag.
Cite as:
S. Filippini Fantoni, . , K. Jaebker, D. Bauer and K. Stofer, Capturing Visitors’ Gazes: Three Eye Tracking Studies in Museums. In Museums and the Web 2013, N. Proctor & R. Cherry (eds). Silver Spring, MD: Museums and the Web. Published January 31, 2013. Consulted .
https://mw2013.museumsandtheweb.com/paper/capturing-visitors-gazes-three-eye-tracking-studies-in-museums/