
Diving into the Museum’s Social Media Stream. Analysis of the Visitor Experience in 140 Characters.
Elena Villaespesa, UK
Abstract
Twitter played a significant role during the festival ‘Art in Action’ at The Tanks, Tate Modern’s new space dedicated to live art. This paper analyses the tweets that mentioned The Tanks during this period and covers the process of collecting, coding and analysing the data following three different lines: Twitter as a communication tool, as a conversation tool to engage with the visitors and as an audience research tool.
Keywords: online research methods, social media monitoring, content analysis, sentiment analysis, twitter, metrics
1. Introduction
Museums and galleries embrace social media and use it as a means to communicate and promote their activities, and also to interact and engage with their visitors (Russo, Watkins, Kelly, & Chan, 2008; Kidd, 2011; Fletcher & Lee, 2012). A large number of museums now have a profile on social media sites to post news, promote their exhibitions, or disseminate their content; and also to organize participatory projects or to create initiatives aimed at interacting with the visitors and starting conversations and debates. However, evaluating the impact of social media is not an easy task. Despite the fact that these platforms are a great source of data, museums struggle to process and make sense of this information due to the lack of consistent or definitive tools and methodologies.
In the last few years, various initiatives have focused on social media metrics, including the website Museum Analytics (http://www.museum-analytics.org), which automatically pulls the main metrics from Facebook and Twitter (e.g., likes, followers, or retweets), creating ranking lists of hundreds of museums around the world. Although these are good benchmarking tools, this exercise only includes quantitative measures, leaving out the context and the museum objectives and showing, therefore, just one part of the whole picture. There is a call for a more insightful way of evaluating that should go beyond analyzing the number of followers and linking metrics to what the museum wants to achieve with its different social media activities (Allen-Greil, 2012; Finnis, Chan, & Clements, 2011).
Moreover, a museum’s presence on social media platforms comes not only from its own online activity, but also from everyday visitors who share content about the museum, express their opinions and experiences, and post photos taken during their visit on platforms like Instagram, Facebook, or Twitter. An online survey published on Tate’s website in December 2012, which aimed to identify the behaviors of our visitors on mobile devices, showed that 26 percent of respondents had shared their own content (blog posts, personal thoughts, photos, etc.) during or after their visit. The widespread use of smartphones clearly influenced this behavior: 12 percent of respondents shared their own content during their visit, while 17 percent claimed to have shared content from their laptop or desktop after their visit. As a result, the amount of online user-generated content about the museum continues to increase at a very fast pace, creating an enormous laboratory of content for social research. Carrying out an in-depth analysis of this data represents a great opportunity for museums to learn more about their visitors and their opinions.
While museums use different sets of metrics to evaluate their social media activities and better understand their online audiences, few actual examples exist of how to implement this research and evaluation. This article aims to contribute to bridge that gap by presenting a practical example featuring an analysis of the tweets about The Tanks, Tate Modern’s new space dedicated to live art. This paper covers research strategies and methods for analysing Twitter data, as well as some of the practical challenges of this micro-blogging platform.
2. “The Tanks: Art in Action”
In July 2012, Tate Modern opened a new space called The Tanks, the world’s first museum galleries permanently dedicated to exhibiting live art, performance, installation, and film work. The Tanks used to contain the oil that fueled the former Bankside Power Station and have now been turned into Tate Modern’s brand-new gallery space by architects Herzog & de Meuron. They are enormous concrete circular spaces of 30-meter diameter and 7 meters high, and they opened their doors to the public with a fifteen-week festival, “The Tanks: Art in Action,” which took place from July 18 to October 28, 2012 (figure 1). The program presented in these industrial spaces featured an array of installations, live performances, and films, including a commission by Korean artist Sung Hwan Kim, the displays of Lis Rhodes and Suzannes Lacy’s work, the Undercurrent festival for young people, and live performances from over 40 artists from around the world. Nicholas Serota, director of Tate, said:
Tate is rooted in showing the collection and working with artists. The Tanks will give us the opportunity to respond to the changing practice of artists, many more of whom are now engaged in installation and performative forms of art than ten or fifteen years ago. It has also become apparent that our audiences seek different forms of participation and engagement. They want dialogue and discussion and The Tanks will provide a forum for such exchange.

Figure 1: The Tanks: Art in Action © Tate Photography
Twitter played a significant role during the festival at The Tanks. It was a key tool of the communication and marketing campaign launched to increase the awareness of the new space and promote the installations and events that took place during the festival. It was also used to foster conversation and debate about live art. An interactive “Comments Wall” was installed at the gallery, and visitors were asked to participate by answering the question, “What do you think?” and adding the specific hashtag #thetanks, which automatically projected the comments onto the Wall. Based on these two main Twitter activity streams, the evaluation aimed to measure the impact of Twitter as a communication and dissemination tool, as well as a means to engage with the visitors at The Tanks. In addition, there was an interest in understanding people’s reactions, insights, and thoughts about this new exhibition space. What visitors tweeted during or after their visit offered a great opportunity to apply content and sentiment analysis and to learn about the main topics they talked about and their overall feeling towards the space and live art program.

Figure 2: The Tanks: Art in Action © Tate Photography
The next sections of the paper will cover in detail the Twitter analysis process following these three lines: Twitter as a communication tool, as a conversation tool to engage with visitors, and as an audience research tool.
3. Methodology
Twitter data
Although online data is openly available and easily accessible, its gathering and synthesizing can imply certain challenges. The data-collection process depends on the social media platform being studied and on the specific tools available for its collection. When it comes to gathering data from Twitter, the two most commonly used methods are via the Application Programming Interface (API) in its streaming or search modes (Twitter, 2012). Twitter has a cap on the number of calls that can be made to the API, a fact that needs to be taken into account when analyzing the sample. Developing the script to connect to the API and to obtain the data requires a good set of technical skills; however, tools allow researchers with no advanced programming skills to successfully undertake this task. The tweets used for this analysis of The Tanks were collected using the Twitter streaming API, which has the ability to record tweets in real time, although the search query needs always to be set up in advance, before the event takes place. The tweets collected included the words “Tate” and “Tanks” or the hashtag #thetanks, which was promoted on the website, in the program leaflet, and in the gallery. The data that was obtained from each tweet is the following: username, name, link, location, followers, and date and time published.
One of the main issues associated with online research is the representativeness of the data or sample selected. Each platform has a different type of user with variations in age, gender, or location; depending on the research topic and the target audience to be analyzed, this can be more or less relevant. For example, in this particular case, the type of users who tweeted about The Tanks may not accurately represent the profile of the visitors that came to the space. Moreover, the selected words are in English, which may exclude some of the tweets from international visitors who translated the word “Tanks” into their own language, or include tweets in other languages not known by the researcher.
Ethics is another important issue about online data that calls for careful analysis and consideration. Online data can be divided into different categories: public and private, published and unpublished, and finally, identified and anonymous (Johns, Shing-Ling, & Hall, 2004). Depending on where the data sits within these classifications, the need to obtain consent will vary. However, it is not as black and white as it may seem, as cases can be found in grey areas. The Association of Internet Researchers (2012) recommends in its guidelines to study ethical implications on a case-by-case basis. There are ethical questions similar to those that arise in non-online research cases, such as the presence of sensitive information or whether the publication of results may harm the subject of research. When it comes to social media, terms of service (e.g., Twitter, 2013) and privacy policies provide information on what data will be collected and how it will be used. In the case of Twitter, creating an account and posting gives consent to the collection and use of the information, even by third parties. A well-known example of this is the project carried out by the U.S. Library of Congress (2013), which is archiving millions of public tweets that will be made available for non-commercial research.
Content analysis
Given the enormous amount of information available online, there is a risk of starting to gather and analyze data before having established clear research objectives, and thus the traditional research design principles should also be applied to the online environment. In this example, a content analysis approach would be suitable. This is a classic technique that is experiencing an increasingly important role in online research. Content analysis is “an approach to the analysis of documents and texts that seeks to quantify content in terms of predetermined categories and in a systematic and replicable manner” (Bryman, 2012). One characteristic of this method is that the data analyzed is “not intended to respond to specific questions. These are texts that are meant to be read, interpreted and understood by people other than the analysts” (Krippendorff, 2012). Although this characteristic makes this method very suitable for the analysis of social media, some authors question whether content analysis can be applied to online research. For instance, Herring (2010) argues that the traditional concept is too limited for this new context and proposes an “expanded paradigm of web content analysis” that will include the analysis of images, themes, features, links, exchanges, and languages.
In this case study, the units of content that have been analyzed are each individual tweet, coded in different categories with a qualitative data analysis software and following a coding scheme (see figure 3). The categories were defined based on the research objectives, but some were also included to reflect various particularities of Twitter. Some of these categories enable tweets to be turned into numbers and percentages, but others also provide the opportunity to code the text by themes or sentiment in order to understand the user’s perceptions and feelings about The Tanks, expressed with words or emotions. An examination of the main quantitative metrics was done with the whole data set, while the more qualitative analysis about actions, themes, and sentiment was undertaken with a sample of the data.
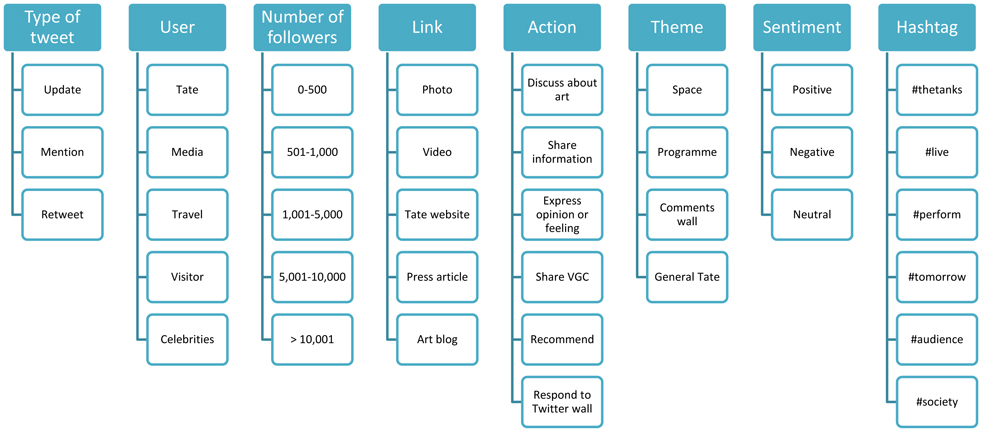
Figure 3: Coding scheme
4. Twitter as a communication tool
Twitter was used as part of the communication and marketing campaign aimed to raise the awareness of these new spaces, promote the live art program, and distribute the related content like blogs or videos posted on the website. In order to better understand the impact of Twitter in spreading the message and increasing the awareness of The Tanks, it is important to have a clear picture of how much buzz was generated around them and to learn about the profile of the users who generated it. The total number of tweets about The Tanks was 12,910 from July 1, when the marketing campaign kicked off, until the end of October, when the festival ended. The main peak in the volume of tweets corresponds to the opening of The Tanks on July 18, but also to the use of Twitter during specific events, such as the “Tweet Me Up!” event led by artist Tracey Moberly, where visitors were invited to participate using social media. We could also analyze the potential reach of the tweets by summing the total number of followers of the accounts that tweeted per day. As we can observe in figure 4, the peak reached when The Tanks opened also corresponds to the maximum message reach, as there was a lot of news in the media. There are other peaks in the reach of the message during the rest of the timeline, corresponding to Tate tweets and those of other influential Twitter users.
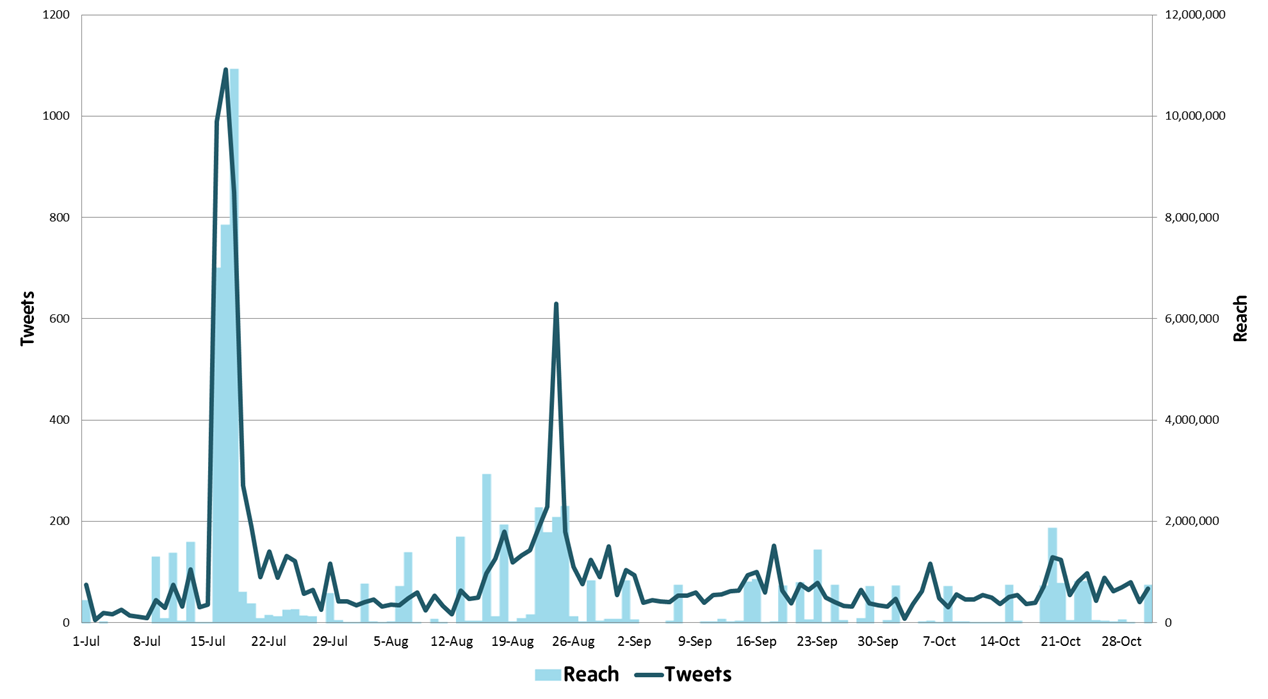
Figure 4: Volume and potential reach of the tweets
Retweets also play an important role in the dissemination of information and, in this particular case, contributed to increase the awareness of The Tanks. Actually, about 30 percent of the total tweets generated were retweets, and by measuring the number of retweets we get a clearer picture of the content that our followers like to share and the level of advocacy among them. With approximately 675,000 followers, the Tate Twitter account already had a significant reach, which was further amplified by an average of 40 retweets per message sent (e.g., figure 5).

Figure 5: Tweet sent from Tate’s Twitter account
Another objective that Tate tried to achieve via Twitter was to drive traffic to the event pages, videos, or blogs on the Tate website or other sites. One of the metrics measured was the number of clicks on the links per tweet—an average of 570 clicks. However, the total traffic to the website is only a partial indicator of the real impact of this activity, so in order to complement that information and measure the number of visitors who were actually brought into the gallery, a specific question was featured in the gallery survey. This question asked visitors where they had read, seen, or heard about The Tanks; 11 percent of the respondents stated this was via Tate’s social media activity.
The tweets about The Tanks came from different types of users, from Tate, visitors, and media accounts among others. Some of these accounts have a huge impact on the reach of the message, as they have a large number of followers and are influential in their field. The following graphs (figure 6) show the distribution of users depending on their number of followers and the potential reach of the tweets—that is, the sum of the number of followers of the Twitter accounts that posted about The Tanks. A total of 8,299 users tweeted or retweeted about The Tanks, 2 percent of whom had over 10,000 followers, and their tweets represent 88 percent of the total reach. This percentage includes Tate tweets, which account for 58 percent of the total reach.
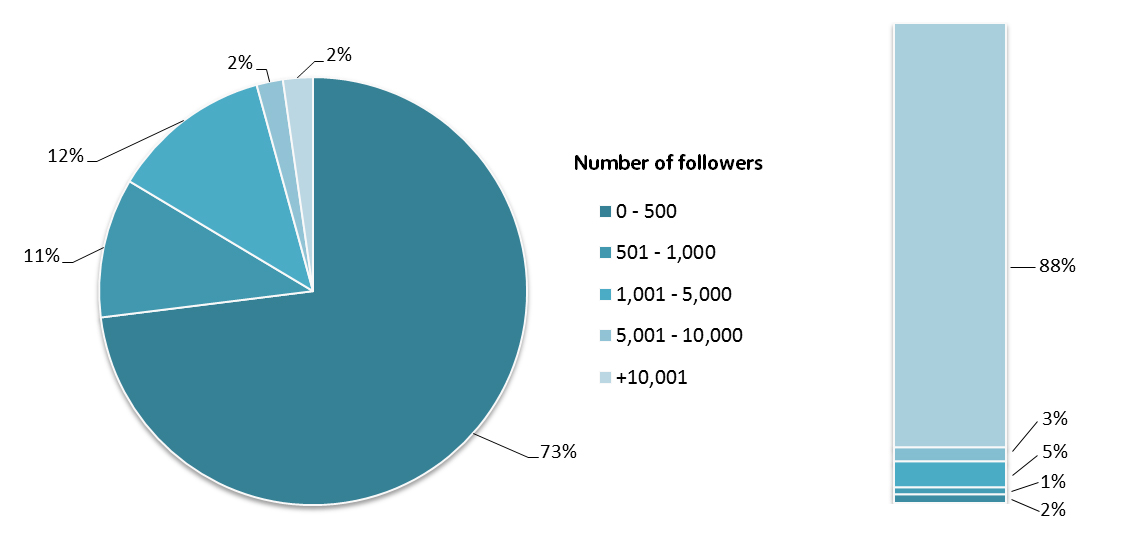
Figure 6: Twitter users by the number of followers (left) and potential reach of the tweets sent by these groups (right)
The user accounts that had over 10,000 followers were categorized in order to understand the type of accounts that could influence the spread of the message. Some examples of these accounts, with the number of followers (in brackets), are shown in table 1:
| Type of account | Example |
| Magazines | Wallpaper magazine (723K), Blouin artingo (308K), Eye magazine (475K), Frieze (56K) |
| Newspapers | The Telegraph (119K), El País cultura (106K), The Independent (82K), Metro UK (39K) |
| TV | BBC News (816K), Channel 4 news (111K), BBC Culture show (25K) |
| Journalists | Polly Toynbee (48K), Miranda Sawyer (32K), Rick O’Shea (21K), Jonathan Haynes (21K) |
| Art venues | Barbican Centre (62K), Southbank Centre (49K), National Museum of Contemporary Art, Korea (45K), Sadler’s Wells (21K) |
| Art website or blog | artnet (365K), REVma_blog (46K), Art Observed (20K) |
| Travel/Events | Condé Nast Traveller (234K), Time Out (136K), BBC Travel (59K), Visit London (51K) |
| Celebrities | Yoko Ono (2,6 million), Elle Macpherson (47K), Bonnie Wright (47K) |
Table 1: Examples of influential Twitter accounts
Although a small group of well-known and influential users had a big repercussion on the reach of the message, the impact caused by a large number of anonymous visitors tweeting about their experiences in the gallery and sharing photos cannot be underestimated. The word of mouth generated via social media is also a very powerful tool to influence the visitors’ close followers and to spread the message due to the viral nature of social media (Hausmann, 2012).
5. Twitter as a tool to create conversation with the visitors
Twitter is used at Tate as not only a communication tool, but also a platform to create conversation with the visitors. At the foyer of The Tanks, a Comments Wall was installed for visitors to reflect on their visit and their experience. The objective was to provide a communal and participatory interpretation resource where discussion, debate, or reflection about live art could take place. Visitors were invited to comment via Twitter, Facebook, and Google+. They needed to include the hashtag #thetanks, and their comment was projected on the Wall almost immediately (figures 7 and 8). The hashtag was not only promoted on the Wall, but also in the leaflet of the program, the website, e-bulletins, and social media activity.
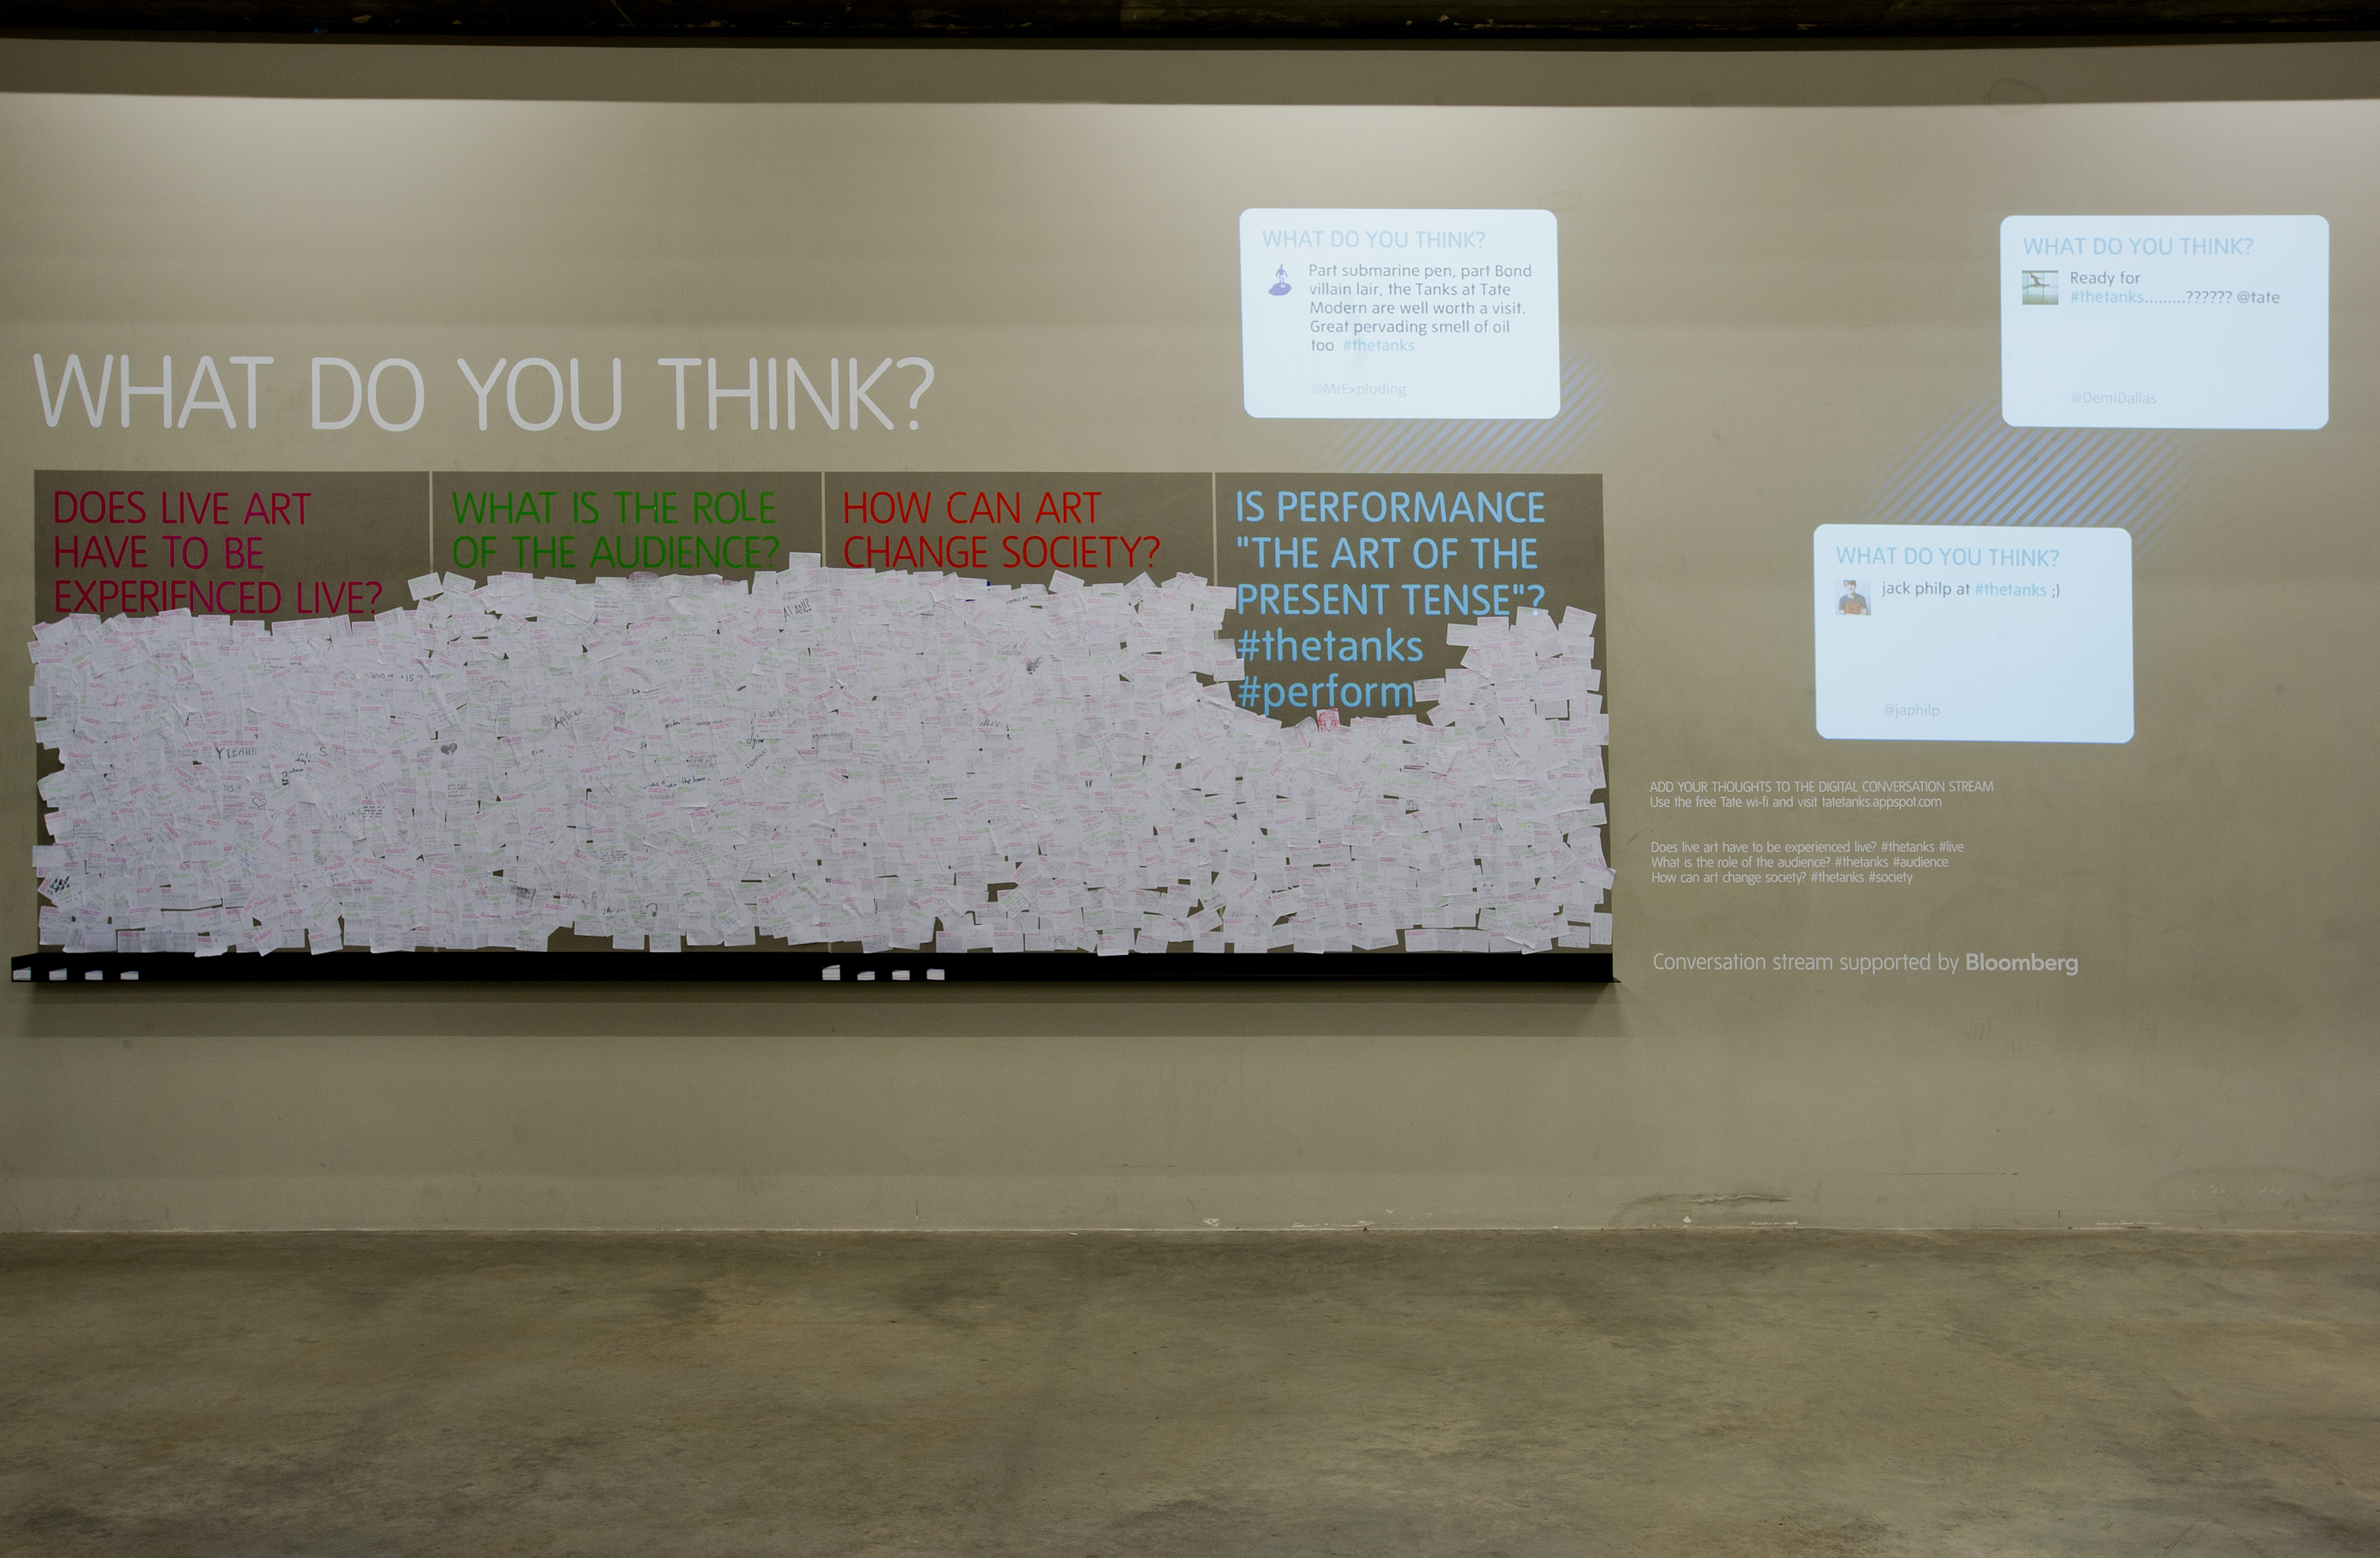
Figure 7: Comments Wall in The Tanks © Tate Photography
The total number of messages that appeared on the Wall was 2,602, and they mainly came from Twitter using the hashtag. This demonstrated the effectiveness of having a hashtag that everyone could use to talk about their experience and bring the conversation to both the digital and physical spaces. Visitors could also respond to some prompt questions, each of them with their own hashtag. Apart from the number of responses, their quality was also taken into analysis. Responses to questions included:
How can art change society?
We shape our art, and then our art shapes us #theTanks #society
In different ways – sometimes with a call to arms, sometimes by making us uncomfortable, sometimes by uplifting us… #thetanks #society
Art allows and opens the debate for change to happen. Change is inevitable, art can show the way #tanks #society #unbrokenline @tate
Does live art need to be experienced live?
A certain kind of art is experienced live,but even as its live,its historicizing itself & creating a historical lineage #theTanks #live
When #live art involves and plays with the “audience”, recordings are something else entirely. #thetanks
#thetanks #live xperience of art must help audience to spiritually develop him/herself.
#thetanks #live nothing compares to experiencing the real thing. Like architecture, it’s not the same in a book.
To influence, and in the end, define. Finally, be the art perhaps. #thetanks #live
What is the role of the audience?
The #audience shapes the art by how they interact with, define and digest the work. They cannot be mutually exclusive #theTanks
#thetanks the role of the #audience is give the art a sense of life and realism. Ocassionally it feels so simple but it looks incredible.
Our role is not to be audience but part of the performance #thetanks #audience

Figure 8: Comments Wall in The Tanks © Tate Photography
It was also found that the Comments Wall was perceived as a very valuable form of participation by the visitors. Many visitors regarded the immediacy of the comments appearing on the Wall as exciting and remarkable.
6. Twitter as an audience research tool
As part of the general audience research for The Tanks, one goal was to learn about people’s reactions regarding this new exhibition space and its program. What can we learn from the tweets sent by visitors? Can sentiment analysis show how visitors felt while visiting the space?
The vast amount of information available on social media channels and its use to express opinions is reflected in the number of tools that are being developed to automatically detect and report people’s opinion on a specific product, topic, or brand. Sentiment analysis, also known as opinion mining, has attracted attention from both commercial organizations and academia. Furthermore, a set of automatic tools have been developed to detect subjectivity in a text, as well as the sentiment behind it, while attributing a positive or negative score (Pang & Lee, 2008). Tools include SentiStrength (http://sentistrength.wlv.ac.uk/) and Linguistic Inquiry and Word Count (LIWC) (http://www.liwc.net/).
Automatic sentiment analysis has been applied to study how people react on Twitter toward brands and their products (Jansen, Zhang, Sobel, & Chowdury, 2009), as well as toward popular topics such as the Oscars, sport events, natural disasters (Thelwall, Buckley, & Paltoglou, 2011), or political elections (Tumasjan, Sprenger, Sandner, & Welpe, 2011). It has even had practical “live” applications when, for instance, during the Olympic and Paralympic Games, the colors of the London Eye changed based on what people’s emotions expressed on Twitter.
However, some researchers have been critical of this analysis approach, questioning its validity and arguing that there is yet no lexical algorithm that can replace human analysis (Branthwaite & Patterson, 2011). This has proven true for our case, as we can see in the following tweets—”Also, the first time I’ve been pushed to real life emotional tears in years #thetanks #theartistispresent” or “The Tanks were weird to say the least but hell I liked it”—which received a negative score from some automatic tools, when in reality they have a positive connotation. Moreover, automatic coding does not disclose the reason why the experience was positive or negative; therefore, getting to know the context of such experience is key to understand the precise elements that impacted the emotions of the visitors and what brought their attention.
Visitors used Twitter before, during, and after visits. In order to get some insights of their reactions, a random sample of 367 opinionated tweets were coded into positive, negative, or neutral and then analyzed (table 2).
| Sentiment | Example |
| Positive | Excellent installations and videos from Suzanne Lacy and Sung Hwan Kim at #thetanks @Tate – what a great addition to #London #art scene’ Went to #thetanks at Tate Modern, and they were an amazing.The dark enclosed rooms showed the artists use of light and sound to the full!Loved The Tanks @Tate Modern. Felt like I was part of the art. Loved how it made me feel. |
| Negative | Just visited the Tank at Tate Modern and I don’t think I understand any of the creepy arts yet. Totally agree with The Guardian’s description of the Performance Tanks at Tate Modern as ‘incomprehensible’ #thetanks far too ambiguous and edgy for me! Can’t understand anything – am i ignorant? |
| Neutral | In the tanks at @Tate Modern Taking part at Undercurrent installation #thetanks I’m hiding in the shadows, watching work at Tate Tanks |
Table 2: Examples of tweets coded depending on their sentiment
Of all the tweets analyzed, 89 percent regarded the experience as positive. The following word clouds show the terms used by visitors to describe their experience at The Tanks. Terms have been divided into positive and negative to get an insight of how people generally felt about the space and the live art program (figures 9 and 10).
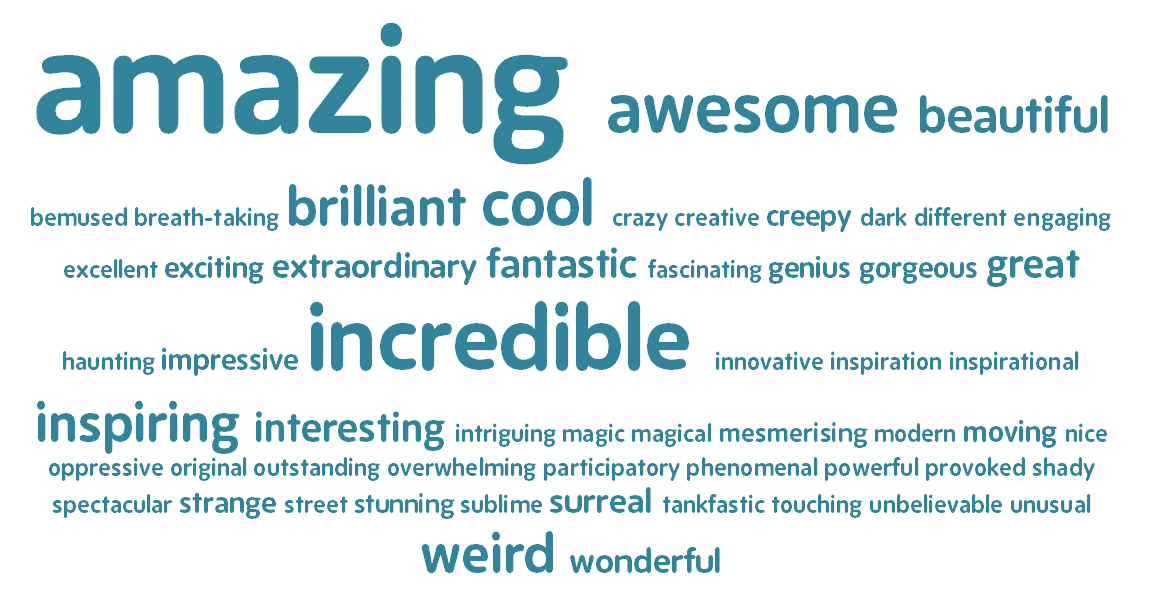
Figure 9: Adjectives used to describe The Tanks by the users who tweeted positively

Figure 10: Adjectives used to describe The Tanks by the users who tweeted negatively
The qualitative part of the analysis allows us to identify themes and situations that emerged from the tweets (figure 11), and the cross-tabulation with the sentiment pinpoints what visitors liked or disliked. While the space and different installations and performances were the most mentioned themes, we can observe how the industrial space deeply impacted the experience, as many tweets labelled the architecture as “amazing” and “incredible” and mentioned as well the light and the smell. Visitors also shared photos of the singularities of the space and of the remaining physical elements of the former oil tanks. The installations, displays, and events featured in the festival program also had a very positive response; so did the Comments Wall, which was regarded by visitors as a great participatory experience. Meanwhile, negative tweets about The Tanks mainly came from visitors who did not feel comfortable in the space because it was, in their own words, too “dark” and “creepy”; or from visitors who did not understand the contemporary art on display.
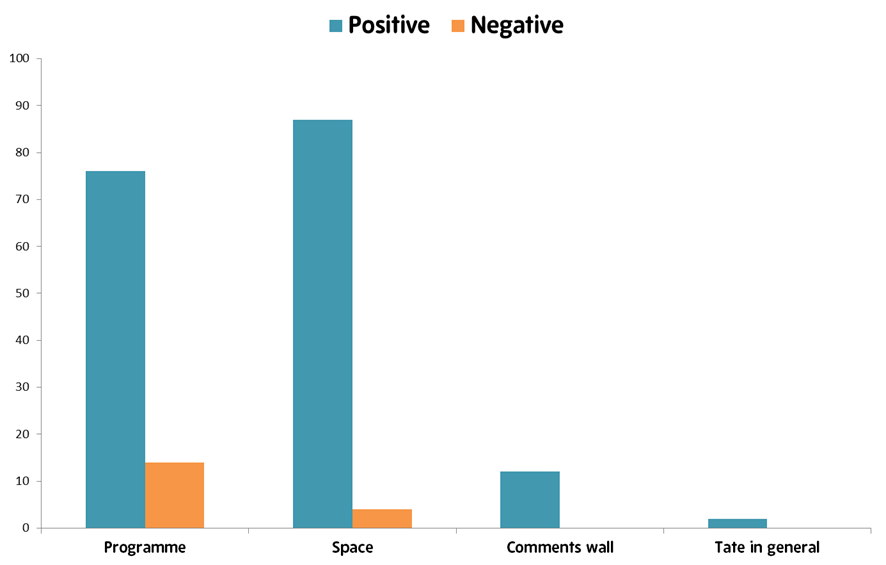
Figure 11: Number of positive or negative mentions by theme
Twitter’s 140-character cap poses certain limitations to this analysis, which may not respond to in-depth questions aimed to shed light on whether The Tanks’ impact on the visitors radically changed their understanding of live art, or to link visitor reactions to demographics and art knowledge. Other variables need to be taken into account, such as what motivates people to tweet, or how the average Twitter user profile matches the demographics of the general visitors. This analysis gives an insight of the overall visitor experience to The Tanks, highlighting the most common feelings, comments, and opinions. Moreover, it was interesting to find out that the themes and reactions registered in this analysis match those recorded by the surveys and observations carried out in the gallery.
7. Conclusion
This study analyzes the thousands of tweets generated about The Tanks by applying different metrics and methodologies depending on the evaluation and research objectives. This was done following three different lines: firstly, it measured the effectiveness of the marketing and communication campaign, examining the volume of tweets during this period, the virality and potential reach of the news, and the traffic generated to the Tate’s website. Descriptive statistics help to get a snapshot of the Twitter activity around The Tanks. Differentiating the activities initiated by Tate from those initiated by other users and identifying key influencers is important to understand the whole Twitter buzz. Secondly, there was an evaluation of Twitter as a channel to create debate and conversations with the visitors about live art. This evaluation looked at the number of comments that used the hashtag, as well as the number of visitors who participated with meaningful responses. Finally, it should be noted that although Twitter can be studied as a medium, it can also be the object of the research itself, by applying a mixed-method approach that integrates both quantitative and qualitative methods. Visitors narrated their activities in the gallery on social media channels, building a rich bank of data that was subsequently analyzed with the aim of gathering their impressions and thoughts on this new space. Content and sentiment analysis allowed for obtaining information of what visitors were commenting and of their overall feeling.
This analysis has been carried out within a specific context at Tate. However, it can be applied to different museum events and activities such as exhibitions, specific products such as memberships, or to wider causes like understanding how the museum brand is perceived by the public. This type of analysis can also be applied to other social media platforms where the museum may have a profile, such as Facebook, Foursquare, Instagram, or YouTube, and where users comment about the museum and its activities; but the particularities of each individual platform should always be taken into account. Further work is needed to experiment and apply research methods to social media in order to continue to define the metrics and to set the ground for drawing comparisons among different cases within the museum sector.
8. Acknowledgements
This is the analysis of the great work done by my colleagues at Tate. I would like to thank John Stack, Tijana Tasich, Emily Fildes, and Maggie Hills from the Online department; Kirstie Beaven, Minnie Scott, and Gillian Wilson, who produced and managed the Comments Wall; Jesse Ringham, who coordinated the marketing campaign on social media; and Sabine Kohler and Katie Raw, whose visitor research undertaken in the gallery complements this work and puts these findings in perspective. Special thanks to my Ph.D. supervisor, Dr. Ross Parry from the University of Leicester, for his guidance and support.
9. References
Allen-Greil, D. (2012). “Measuring, analysing and reporting”. In Conversations with visitors: Social media and museums. Edinburgh: MuseumsEtc, 34–73.
Association of Internet Researchers. (2012). “Ethical decision-making and Internet research 2.0: Recommendations from the aoir ethics working committee.” Ethics Guide. Consulted January 27, 2013. http://aoir.org/documents/ethics-guide/
Branthwaite, A., & S. Patterson. (2011). “The power of qualitative research in the era of social media.” Qualitative Market Research: An International Journal 14 (4), 430–440.
Bryman. A. (2012). Social research methods. Oxford: Oxford University Press.
Finnis, J., S. Chan, & R. Clements. (2011). “Let’s get real: How to evaluate success online?” WeAreCulture24. Brighton: Culture24. Consulted January 13, 2013. http://weareculture24.org.uk/projects/action-research/
Fletcher, A., & M. J. Lee. (2012), “Current social media uses and evaluations in American museums.” Museum Management and Curatorship 27(5), 505–521.
Hausmann, A. (2012). “The importance of word of mouth for museums: an analytical framework.” International Journal of Arts Management 14(3), 32–43.
Herring, S. C. (2010). “Web content analysis: Expanding the paradigm.” In J. Hunsinger, L. Klastrup, & M. Allen (Eds.). The international handbook of internet research. Dordrecht: Springer, 233–250.
Jansen, B. J., M. Zhang, K. Sobel, & A. Chowdury. (2009). “Twitter power: Tweets as electronic word of mouth.” Journal of the American Society for Information Science and Technology 60, 2169–2188.
Johns, M. D, S. C. Shing-Ling, & G. J. Hall. (2004). Online social research: methods, issues & ethics. New York: P. Lang.
Kidd, J. (2011). “Enacting engagement online: framing social media use for the museum.” Information Technology & People 24(1), 64–77.
Krippendorff, K. (2012). Content analysis: An introduction to its methodology. Thousand Oaks, California: Sage.
Library of Congress. (2013, January). “Update on the Twitter Archive at the Library of Congress.” Press release. Consulted January 5, 2013. http://www.loc.gov/today/pr/2013/files/twitter_report_2013jan.pdf
Pang, B., & L. Lee. (2008). “Opinion mining and sentiment analysis.” Foundations and Trends in Information Retrieval 2(1-2), 1–135. Consulted January 5. 2013. http://www.cs.cornell.edu/home/llee/omsa/omsa-published.pdf
Russo, A., J. Watkins, L. Kelly, & S. Chan. (2008). “Participatory communication with social media.” Curator: The Museum Journal 51, 21–31.
Tate. (2012, December). Mobile Audience Research.
Thelwall, M., K. Buckley, & G. Paltoglou. (2011). “Sentiment in Twitter events.” Journal of the American Society for Information Science and Technology 62, 406–418.
Tumasjan, A., T. O. Sprenger, P. G. Sandner, & I. M. Welpe. (2011). “Election forecasts with Twitter: How 140 characters reflect the political landscape.” Social Science Computer Review 29, 402–418.
Twitter. (2012). “Documentation.” Consulted October 20, 2012. https://dev.twitter.com/docs
Twitter. (2013). “Terms of Service.” Consulted January 27, 2013. https://twitter.com/tos
Cite as:
E. Villaespesa, Diving into the Museum’s Social Media Stream. Analysis of the Visitor Experience in 140 Characters.. In Museums and the Web 2013, N. Proctor & R. Cherry (eds). Silver Spring, MD: Museums and the Web. Published January 31, 2013. Consulted .
https://mw2013.museumsandtheweb.com/paper/diving-into-the-museums-social-media-stream/
One thought on “Diving into the Museum’s Social Media Stream. Analysis of the Visitor Experience in 140 Characters.”
Leave a Reply
You must be logged in to post a comment.
This Social Media Analytics is nice.This type of analysis can also be applied to other social media platforms where the museum may have a profile, such as Facebook, Foursquare, Instagram.